According to cat owner statistics, there are millions of households that own at least one cat. In the United States, cats are the second most favorite pet after dogs.
Cats become equal members of many families and owning a pet requires additional expenses. Do you know how much average cat owners spend every year on food, toys, veterinary, and other services?
The trend of adoption increasing every year, and more and more owners decide to have at least one cat at home. If you want to find out some of the st interesting facts about this topic, we picked 21 best cat statistics which you can check if you continue reading this article
10 Most Interesting Cat Owner Facts
(Editor’s pick)
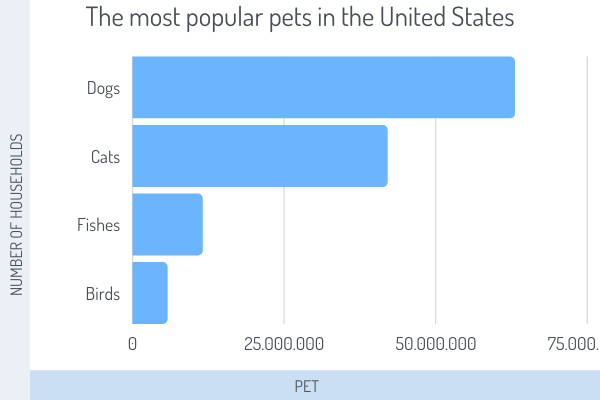
- Around 43 million households in the United States own a cat.
- About 87% of cats in households are neutered or spayed.
- Vermont has 44.6% of households that own a cat.
- Leading cat owners are Millennials with 31%.
- The average cat owner spends around $286 each year.
- Pet expenses reached $99 billion in 2020.
- Indoor cats live for 12-15 years.
- About 68% of cat owners give their pets a present for Christmas.
- About 85% of adopted cats during global pandemics still have homes.
- Around 100,000 cats that enter animal shelters are returned to their owners.
List Of 21 Cat Owner Statistics
1. There are more than 400 million cats in the world
Cat overpopulation shows there are more than 400 million cats in the world. One of the biggest problems according to this number is a lot of stray and feral cats.
Of the 400 million cats, around 375 million are pets in the largest countries, including the United States. This shows that people love having a cat as a pet and it is one of the most favorite animals in the world.
Source: petpedia.co
2. Around 43 million households in the United States own a cat
According to statistics, the United States is one of the leading countries with most households that own at least one pet. The most popular ones are dogs, and in the second place are cats. Cat statistics from the last year show how 42.7 million households have a cat, and most of them are mixed breeds.
Data from American Pet Products Association in 2015-2016 show that 85.8 million cats found their home in the United States. Comparing it to 2011. there were 74. 1 million pet cats. Till now experts believed there are more than 94 million pet cats in the United States.
Source: petpedia.co
3. About 87% of cats in households are neutered or spayed
Because of a fast-growing number of newborn cats every day, neutering and spaying are a must-have, especially for owners that have a family cat. Statistics in the United States show how around 87% of these cats are spayed or neutered, which will help to lower the cat overpopulation every year.
Source: petpedia.co
4. The average household in the United States has 2 cats
According to different surveys, about 25.4% of households own at least one cat, and the average number of cats per household is 2 or more.
Comparing it to the number of households that own a dog, in the United States there are 53% of households with a dog and only 35.7% have cats. Some families own both, dogs and cats, and many of them get along really well.
Source: petpedia.co
5. Statistics show that around 46% of cat owners learned about pets through word of mouth
There are many ways to find out about adoption, and they usually include mouth-to-mouth communication, animal shelter information, or social media posts.
According to statistics, learning about pet adoption through word of mouth is the most successful way, and around 46% of pet owners learn it that way. About 31% of cats are adopted from shelters and 27% of them were stray animals.
Source: aspca.org
6. Vermont has 44.6% of households that own a cat
There are many top states with the highest percentage of households with a cat, but Vermont is definitely number 1. According to pet ownership statistics, about 44.6% of Vermont citizens have at least one cat at home, which is almost half of all households.
Source: petpedia.co
7. Only 16.4% of District Columbia household own cat
The state with the lowest rate of cat ownership, with only 16.4%, is the District Of Columbia. This state also has the lowest dog ownership rate, where only 22.5% of families own at least one dog. We can assume that citizens in the District Of Columbia don’t prefer having a pet in their houses.
Source: petpedia.co
8. Leading cat owners are Millennials with 31%
The newest cat statistics by generation show that Millenials have 31% households with pets. About 50 of them own at least one cat at home. In the second place are Baby Boomers with 29% and Gen Xers generation with 26% is in the third place.
More than half of Millenials see their cats as their children, and many cat owners consider pet is equal family member and their best friends. Comparing it to data from 2011, about 56 % of owners said their pet is a family member 5 years later around 76% of pet owners think the same.
Source: petpedia.co
9. The average cat owner spends around $286 each year
Having a pet requests additional expenses on food, supplies, medication, and different care services. According to a survey from 2020., the average cat owners spend $286 every year.
The highest amount of the money goes on food, especially for the breed that requests special dietary needs and premium food. About $228 goes for food and $58 on treats. Veterinary visits go in additional costs and can easily higher annual expenses, especially if the cat has health issues that request frequent checkups.
The least amount goes on toys and owners spend approximately $31 for mice and feather toys as well as for scratchers. Having a cat is definitely less expensive than owning a dog.
Source: petpedia.co
10. Pet expenses reached $99 billion in 2020
Including all expenses like supplies, medications, veterinary care, grooming, and cat food, statistics from 2020 show that pet expenses reached 99$ billion. This number shows that cat ownership increase as well as expenses every year.
Source: petpedia.co
11. Average amount spend on veterinary care in 2016. was $890
Veterinary expenses can reach a few thousand dollars, especially if the cat needs to get surgery or have a disease that requests monthly check-up and medications.
According to the AVMA sourcebook, in 2012. expenses for veterinary care per cat were only $90. Only a few years later, the amount went to $890. The reason for the much bigger amount was much more cat adoption throughout the year as well as higher prices for veterinary services.
Source:humanepro.org
12. Around 44% of cat owners immediately introduce cats to their established pet
Having 2 pets that didn’t grow together can cause a lot of trouble because of different behavior, especially if they’re a dog and cat according to a study from 2005 of 375 cats adopted, about 44% of them immediately introduce their cat to their pet, no matter if it was a dog, cat or some other animals.
About 22% of pet owners introduce the cat after a few days while 33% of pet owners waited for a longer period and introduce them more gradually. Most of the pet owners were afraid because of the possible fight for food, or a place for sleeping. Expert recommend gradual introduction which will reduce the stress for a cat and other pet in the house
Source: mentalfloss.com
13. About 21% of cat owners spend more during the Covid-19 pandemic
A global pandemic has an impact on pet owners, and pet industry stat revealed that about 21% of pet owners spend more during global pandemic because of the Covid-19 virus. The average owners spend around $687 in one year, which is double the average expenses before the pandemic.
The main reason why pet owners spend more is because of the time they spend in a house, which included much more pet care, food, treats, and toys. Many pet owners spend days in quarantine which was the perfect time to spoil their pets even more.
Source: petpedia.co
14. Indoor cats live for 12-15 years
It was scientifically proved that cats that live in better conditions, and care of their owners live much longer than stray or animal shelter cats. According to statistics, the average lifespan of an indoor cat is from 12 to 15 years.
How long your cat will live to depend on many factors, like the breed. For example, the average Persian cat lives for 17 years, and for some breeds, it is normal to live for 20 years. The world’s longest-living cat that holds Guinness record was the Creme Puff cat, which lived for 38 years.
Source: mentalfloss.com
15. Half of the cat owners got pets to keep them company
Pets have a positive impact on mental health, and many humans decide to have a pet to keep them company. According to statistics, about 52% of them said they got a pet to not feel bored while at home, especially if they’re living alone.
Source: petpedia.co
16. About 68% of cat owners give their pets a present for Christmas
Pets became equal members of the families, so many of their owners don’t forget to prepare the present for Christmas. According to surveys, about 68% of Americans buy a present for their cat, which includes treats or toys.
The same percentage of pet owners think their pets also need to be rewarded for the holidays and buying a gift for their pet makes them happy.
Source: gallup.com
17. Around 43% of owners got cats from animal shelters or rescues
Animal shelters all over the country are overcrowded with the number of cats, but fortunately, the number of adoption increasing every year. APPA report from 2019 and 2020. show that around 43% of owners got their cats either from an animal shelter or rescue them from the street.
Only 12% of them bought a cat in one of the pet stores or got from family ad friends. The lowest percentage, only 3% of owners, bought a cat from local breeders.
Source: petpedia.co
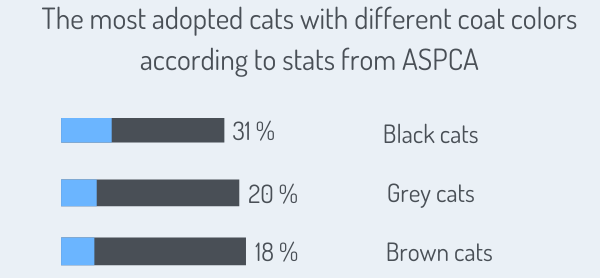
18. According to stats, around 31% of adopted cats are black ones
In some cultures, a black cat brings luck, and in some means bad luck, but fortunately, this myth doesn’t affect the adoption rate from animal shelters. According to ASPCA data and 300,000 adoptions from 14 regions in the United States, 31% of them were black cats, 20% grey, and 18% brown ones. Many cats are mixed breeds and have many colors on the coat.
The adoption of black cats increasing every year, which will lower the euthanasia rate which was the highest one many years.
Source: petkeen.co
19. About 82% of kittens get adopted
Different statistics show how pet owners pick their new cat, do they prefer kittens or older cats. The results show that more kittens are adopted than older cats, which is about 82% of them.
When a cat reaches 18 months, the interest for adoption gets much lower. According to shelter stats, about 60% of older cats will find new owners.
Source: petpedia.co
20. About 85% of adopted cats during global pandemics still have homes
It was not expected that pet adoption will increase during the global pandemic because of the Covid-19 virus, but most pet owners adopt cats to have a company.
According to statistics, after two years of the pandemic, about 85% of cats adopted from animal shelters or found on the street are still in their new home.
Source: petkeen.co
21. Around 100,000 cats that enter animal shelters are returned to their owners
If the cat is alow to be outside, it is not rare to easily get lost, especially because they’re hunters and love to limb everywhere. Many of found cats on the street enter animal shelters and fortunately many of them found their owners again. According to cat shelter statistics, about 100,000 cats are returned to their owners after they get lost.
Source: aspca.org
To Sum Up
Cat owners statistics show that more than 42 million households in the United States and many of them own 2 or more cats as pets. The adopting rate increased during the global pandemic and around 85% of cats adopted in the last 2 years still have homes. The average cat owner will spend at least $280 for the cat which included expenses for food, veterinary care, medications, and additional pet care services. Every year many cats get lost and end in animal shelters ut fortunately more than 100,000 of them were reunited with their owners.